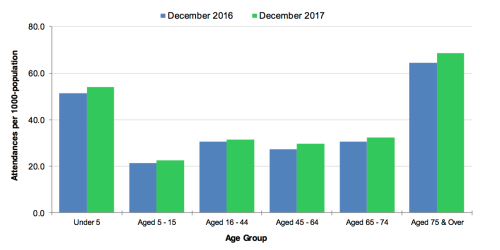
The chart below shows figures for attendances at hospital emergency care departments in Northern Ireland by age group in December 2016 and December 2017.
下面的图表显示了2016年12月和2017年12月在北爱尔兰的医院急诊科的出席人数。
Use the chart above to fill the gaps in the sentences below.
1.The rate of hospital emergency care attendances in Northern Ireland _____ for all age groups between December 2016 and December 2017.
2.In both of the months shown, the highest number of emergency care visits was recorded for those _____ _____ _____ _____.
3.The _____ number of attendances was recorded in the 5 to 15 age group.
The bar chart compares the number of visits made by people in six age categories to hospital emergency wards in Northern Ireland in the December of 2016 and 2017. 答案: 1. increased / rose
2. aged 75 and over
3. lowest(
(选中黑色部分就能看的答案)
范文:
It is clear that elderly people and the youngest children were the most frequent visitors to A&E (accident and emergency) departments. Also, there was a slight increase in the rate of emergency care attendances among all six age groups from December 2016 to December 2017.
Looking first at the older age groups, roughly 65 out of every 1000 people aged 75 and over attended A&E wards in December 2016, and this rose to almost 70 attendances per 1000-population one year later. Interestingly, those aged 65 to 74 were less than half as likely to require emergency treatment, with around 30 attendances per 1000-population in both months.
At the other end of the age scale, the figures for A&E visits by under-5s rose marginally from around 50 to approximately 52 per 1000-population over the one-year period. Children aged 5 to 15 made the fewest visits, at just over 20 per 1000-population in both months. Finally, there was almost no difference in the figures for emergency care attendances among people aged 16 to 44, 45 to 64 and 65 to 74.
(217 words, band 9)
雅思小作文条形图实例范文解析
发布日期 :2018.07.02 浏览次数:4184 次


